You're viewing an archived page. It is no longer being updated.
Analyzing Test Box Data
- Ask us for the data.
- Install ROOT on your system.
- Support files and examples.
- Advanced use
- Standalone ROOT based applications
1. Ask us for the data
This is easy. Simply send an email and ask us for the data. We have tools to extract any subset from the full data-sample and can run them for you. A small subset can usually be extracted the same day, larger samples take longer.
For each day in the requested period, we will create a file containing all data originating from and recevied by your box.
the resulting set of files will be put on a special location of our FTP server that is only visible to you. Instructions on how to retrieve the data will be mailed to you. Since we do not have unlimited space on our server, please inform us when you have copied the files to your site.
At the RIPE NCC, we are using CERN's ROOT package to process and store all test traffic data. ROOT provides an "object oriented data analysis framework", featuring graphics, histogramming, a C++ interpreter and object I/O. This provides a nice environment for (interactive) analysis and data presentation. The files that we create are therefore using the ROOT file format, which brings us to the next question: how to get ROOT.
2. Install ROOT
ROOT is available for free and supported on a lot of platforms, including most Unices and Windows 95 or NT. Installation is described in the download section of the ROOT website, http://root.cern.ch. One can usually find a "new" or development version, a stable production version and "old" versions there. In general, go for the stable version. You have two options:
- Download the complete ROOT source tree and install from scratch.
- Download a precompiled binary distribution for your specific platform.
Note that in most installations you will have to set some environment variables prior to running the software (so ROOT knows where to look for its shared libraries). To verify your installation, it's a good idea to try to compile and run the suite of ROOT test programs found in the root/test directory. After that, proceed with a few of the tutorials from the ROOT website, in order to get a basic feeling for the program.
If you run into trouble, take a look at the ROOT website, in particular the HOWTO's as well as the archives of the RootTalk mailing list. If you have a problem, chances are that somebody has already seen and solved it before. The (draft) User's Guide gives a nice introduction as well as more background information on ROOT.
3. TTM support library and examples.
Once you have verified your ROOT installation to function properly, you are ready for the next step: creation of the support library for TTM analysis.
To allow easy combination of multiple files into one bigger data set, the test traffic data are stored in TTree objects. Each TTree has a collection (usually one day) of delay measurements, which are stored in objects of a class Delay, which has been defined by us. This class' definition and its member functions have to be made known to ROOT by dynamically loading a shared library.
The source code for the Delay class library can be loaded from our ftp site: ftp://ftp.ripe.net/test-traffic/ROOT/libDelay. Adapt the Makefile to suite your installation, then create the library by running make. Now you are ready for your first steps in TTM analysis:
- Start ROOT and load the delay library:
    $ root
      *******************************************
      *                                         *
      *        W E L C O M E  to  R O O T       *
      *                                         *
      *   Version   2.25/03 14 September 2000   *
      *                                         *
      *  You are welcome to visit our Web site  *
      *          http://root.cern.ch            *
      *                                         *
      *******************************************

    CINT/ROOT C/C++ Interpreter version 5.14.50, Sep 2 2000
    Type ? for help. Commands must be C++ statements.
    Enclose multiple statements between { }.
root [0] gSystem.Load("libDelay.so"); - attach a file with TTM data and load the TTree:
root [1] TFile f("tt46.ripe.net.20000809.root")(in this case we load all data send from and received by box 46 on Aug 9th, 2000)
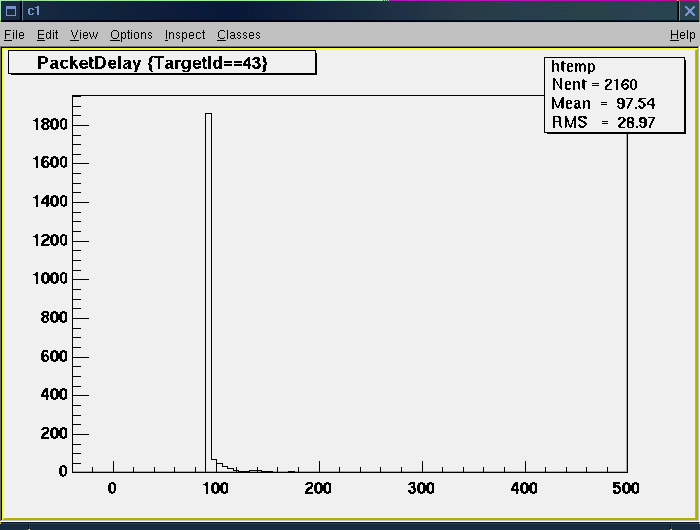
root [2] TTree *T = (TTree*)f.Get("tree"); - create simple graphs, delay vs. time and delay distribution for packets send to tt43
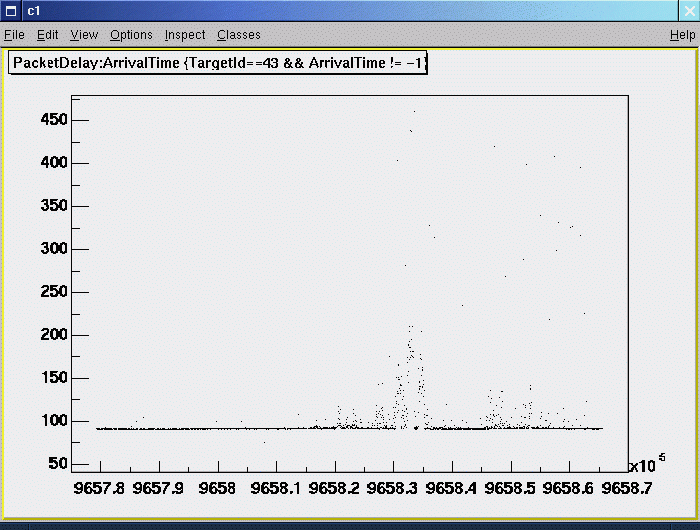
(example output here and here)root [3] T->Draw("PacketDelay", "TargetId==43");Note: The "ArrivalTime != -1" condition restricts the data set to packets which did reach the target machine.
root [4] T->Draw("PacketDelay:ArrivalTime", "TargetId==43 && ArrivalTime != -1"); - inspect the data, look for events with delay >500ms
    root [5] T->Scan("PacketDelay:ArrivalTime:SourceId:TargetId", "PacketDelay>500");
    ************************************************************
    *    Row   * PacketDel * ArrivalTi *  SourceId *  TargetId *
    ************************************************************
    *      548 *   527.317 * 965779940 *        46 *        24 *
    *     1593 *  1098.764 * 965781130 *        46 *        39 *
    ...
    *     9051 *   572.667 * 965789844 *        46 *        24 *
    Type  to continue or q to quit ==> q
    ************************************************************
==> 25 selected entries - quit ROOT
root [6] .q
In the examples above, the first string argument lists the parameter(s) to be plotted or printed, the second string argument provides a boundary condition that must be fulfilled. The parameters which are available for plotting/printing and selection are the data members of the Delay objects, as listed in the class definition file Delay.h.
4. Advanced use
loading more than one file
When more than one day's worth of data has to be analysed, the file loading procedure changes a bit. Instead of a TFile object, TTM data are now accessed via a TChain object:
        root [0] gSystem.Load("libDelay.so");
	root [1] TChain T("tree");
	root [2] T->Add("tt46.ripe.net.20000809.root")
	root [3] T->Add("tt46.ripe.net.20000810.root")
	root [4] T->Add("tt46.ripe.net.20000811.root")
The big advantage of ROOT is that apart from this initialization, the analysis code does not change; you can use TTree:Draw() and TTree:Scan() methods like above, ROOT's I/O system will take care of fetching the right data from the right file!
more control over display parameters
The default graphs produced by Draw() provide a quick insight in the data, but pretty soon you will find yourself in a situation where you want more control over the display, e.g. setting x- & y-axis scales, line & marker colors, and for comparison put two graphs on top of each other. For this purpose, one has to create a histogram object, which can be filled either by a call to the TTree Draw() method (or as we will see in a next example through individual calls to the histogram Fill() method while looping over the data):
- Retrieve range for x-axis from the data:
    root [5] cout << T->GetEntries() << endl;
    214920

    root [6] T->Scan("ArrivalTime","","",1,0)
    ************************
    *    Row   * ArrivalTi *
    ************************
    *        0 * 965779328 *
    ************************

    root [7] T->Scan("ArrivalTime","","",1,214919)
    ************************
    *    Row   * ArrivalTi *
    ************************
    *   214919 * 966038395 *
************************ - Create a TH2F histogram object and fill with TTree:Draw()
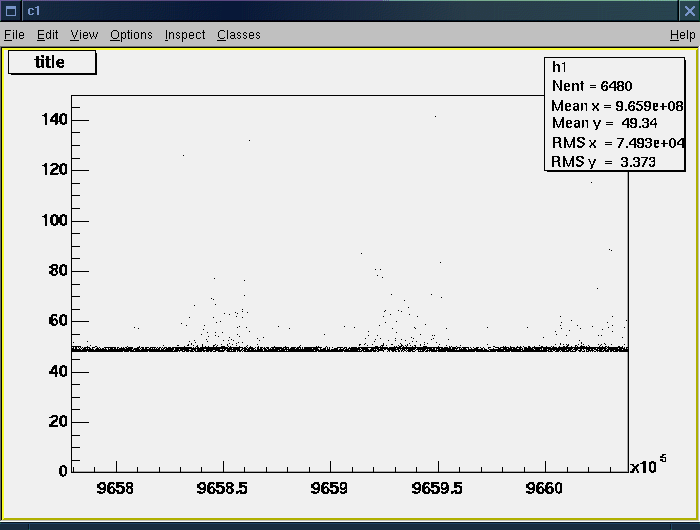
(example output)root [8] TH2F h1("h1", "title", 200, 965779328, 966038395, 150, 0, 150.0)
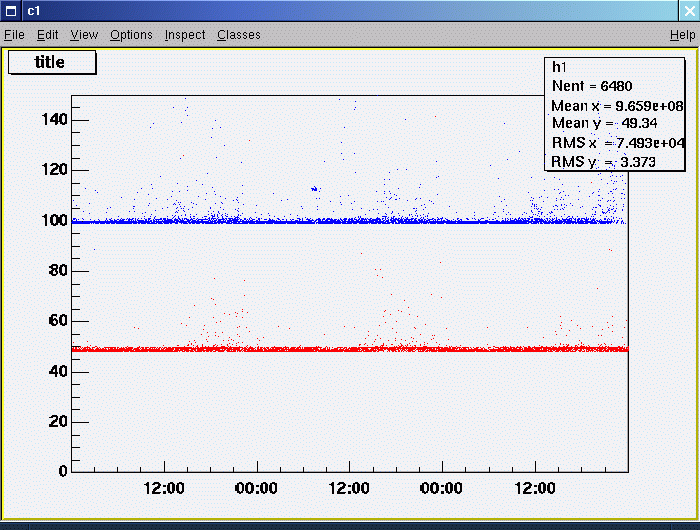
root [9] T->Draw("PacketDelay:ArrivalTime>>h1","TargetId==23"); - Set color attribute, switch to human friendly time and redraw:
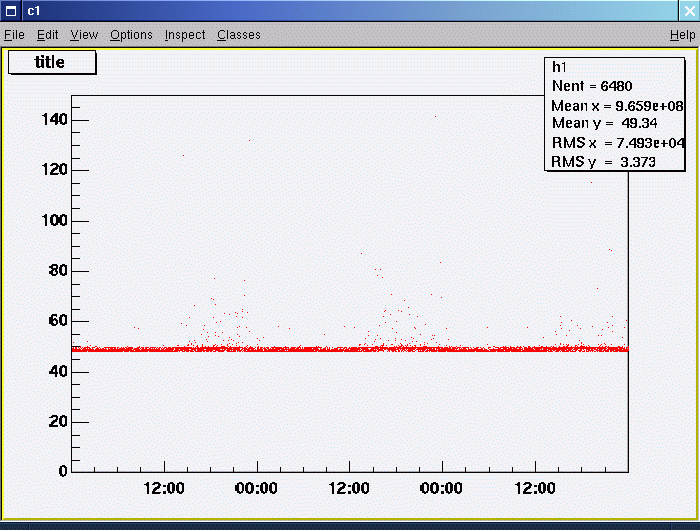
(example output)root [10] h1->SetMarkerColor(2);
root [11] h1->GetXaxis()->SetTimeDisplay(1);
root [12] h1->GetXaxis()->SetTimeFormat("%H:%M");
root [13] h1->Draw(); - Create second histogram, store data for another target and overlay with first histogram:
(example output)root [14] TH2F h2("h2", "title", 200, 965779328, 966038395, 150, 0, 150.0)
root [15] T->Draw("PacketDelay:ArrivalTime>>h2","TargetId==30")
root [16] h2->SetMarkerColor(4);
root [17] h1->Draw(); /* redraw h1 */
root [18] h2->Draw("SAME"); /* overlay h2 */
looping over all data
When the data selection is more complicated than a simple if clause, when more than one histograms should be filled in a single pass through the data or when the analysis requires access to individual delay measurements, one has to write some code that loops over all data. For non time-critical applications this can be in the form of a macro for ROOT's C++ interpreter. For example, if the file macro.C contains the following code:
{
TChain T("tree");
T.Add("tt46.ripe.net.20000809.root");
T.Add("tt46.ripe.net.20000810.root");
T.Add("tt46.ripe.net.20000811.root");
TH2F *hist1, *hist2;
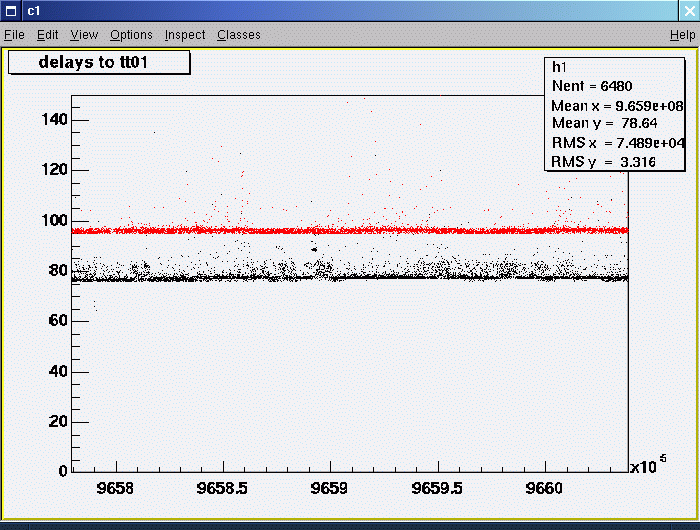
hist1 = new TH2F("h1", "delays to tt01", 200, 965779328, 966038395, 150, 0, 150);
hist2 = new TH2F("h2", "delays to tt31", 200, 965779328, 966038395, 150, 0, 150);
// create a Delay object for storage of per event data
Delay *delay = new Delay();
T.SetBranchAddress("delay", &delay);
Int_t nTotalEvents = T.GetEntries();
cout << "Total #entries:" << nTotalEvents << endl;
for (Int_t eventNo=0; eventNo < nTotalEvents; eventNo++) {
// read next delay into memory and check clock status
if ( (T.GetEvent(eventNo) > 0) && (delay->ClocksOK()) ) {
// we do have some data AND both source and target clocks
// have good status
// get parameters
Double_t packetDelay = delay->GetPacketDelay();
Double_t arrivalTime = delay->GetArrivalTime();
Int_t targetId = delay->GetTargetId();
if (targetId == 1) {
hist1->Fill(arrivalTime, packetDelay);
}
else if (targetId == 31) {
hist2->Fill(arrivalTime, packetDelay);
}
}
}
hist1->Draw();
hist2->SetMarkerColor(2);
hist2->Draw("SAME");
}
it can be executed in ROOT by typing:
(example output)
root [17] .x macro.C
The above is sufficient for simple macros, but when code becomes more complex and the user wants to pass parameters to the macro, the loading procedure changes a little. First modify the source file such that instead of a unnamed {...} block it has (one or more) named functions, e.g. create a file macro2.C containing:
    void mymacro(char *box="tt01.ripe.net", Int_t target=2){
    	cout << "Boxname: " << box << endl;
    	cout << "TargetId: " << target << endl;
    }
then load the file with
root [18] .L macro2.C
Now the "mymacro" function can be executed as often as desired:
    root [19] mymacro();      /* use default parameters */
    Boxname: tt46.ripe.net
    TargetId: 2

    root [20] mymacro("tt46.ripe.net",51);
    Boxname: tt46.ripe.net
    TargetId: 51
Since the macros are really C++ code, they provide a powerfull means of scripting: systems calls, library functions, ROOT classes and private class definitions, all are available for coding macros. However, when processing a lot of data, the overhead of interpretted C++ becomes noticable and will slow analysis; at that point one has to switch from the interactive environment, to a more batch oriented mode, where the user's code is compiled and linked with ROOT libraries to make an executable. This is discussed in the next section.
5. Standalone ROOT based applications
In the preceding sections, we showed examples of looking at TTM data from within ROOT's interactive environment. Here we discuss how to make applications which build on the ROOT framework, but do not use the C++ interpreter. This is especially usefull when the application should run in batch mode without human intervention, or when you reach limitations of the interpreter.
After presenting the concepts, we will continue with the case study of the moderately complex delayplots program we use internally to create daily TTM plots.
Turning a macro into a program
When a program is not running in the ROOT CINT environment, the code has to be extended with appropriate class definitions (i.e. #include statements) and intialisation of the ROOT framework. In general each ROOT class has a corresponding include file (e.g. TTree.h for TTree objects), but when in doubt one can search for the correct file in the root/include directory.
If we take the above unnamed macro as example, the following needs to be changed to make it ready for standalone usage:
- load the class definitions:
#ifndef __CINT__
The last file has the definitions of the TTM Delay class, the others are from ROOT itself. Enclosing the statements in a
#include "TROOT.h"
#include "TApplication.h"
#include "TCanvas.h"
#include "TChain.h"
#include "TTree.h"
#include "TH1.h"
#include "TH2.h"
#include "Delay.h"
#endif#ifndef CINTclause, allows the same code to be called either as a macro or compiled as standalone program. - put the {..} block in a function:
    main () {
    ...
} - add code for ROOT initialisation
    #ifndef __CINT__
        TROOT simple ("TTM", "Plots");
        TApplication app("delayPlots", NULL, NULL, NULL, 0);
#endif - create a canvas for graphics output, before calling the histogram Draw() methods.
TCanvas canvas(); /* Default sized canvas */
- after drawing histograms, update canvas and enter the ROOT event loop to show window content and allow user interaction.
        canvas.Update();
    #ifndef __CINT__
        app.Run();
    #endif
Now you can compile the code, using compiler options similar to those in the Makefile from the ROOT test suite (root/test/Makefile).
The delayplots program
As an example of a moderately complex standalone ROOT application, we publish the source of the delayplots program (which we use at RIPE NCC to create the daily TTM plots) on our FTP site. It illustrates some advanced concepts of ROOT, such as subdividing the Canvas to get four graphs on one page, color attributes, graphics output to PostScript file etc. The bulk of the work is carried out by the DelayPlots class, specifically through the public methods Fill(), which processes all requested data and fills the histograms), and Plot(), which creates plots in PostScript and, if requested, GIF format.
Disclaimer: the code is published as an example, to help you build your own ROOT application program. By no means can we guarantee this is the latest version of the code; also it may not work in your environment without modification (because of dependencies on RIPE NCC's internal TTM configuration database).