Evaluating The Effects Of Anycast On DNS Root Nameservers
- Publication date:
- 20 Oct 2006
- State:
- Published
- Author(s)
- File(s)
- PDF (2.8 MB)
Abstract
The DNS root nameservers are a critical part of the Internet's infrastructure, and anycasting is increasingly being used in their deployment. However, while there is little doubt that anycasting improves resilience, its effects on other aspects of DNS service quality are not well understood. We present methodologies to study the quality of service provided by an anycast server cloud, combining analysis of packet traces and server logs with active measurements from both the client and the server side to evaluate both aggregate performance and the benefit of each individual anycast node. We apply the methodologies to the K-root server and, in contrast to other work, find that anycast is effective in decreasing latency and preserving node affinity, suggesting that the impact of anycast depends heavily on the type of deployment used. We also study the effects of K-root's anycast deployment model on server load and routing, highlighting particular scenarios in which the model can lead to performance and reachability problems.
Table of Contents
4 Application of our methods to K-root
6 Effect of anycast on server load
1 Introduction
The Domain Name System [16, 14, 15] is a database of Internet names and addresses, which is used, for example, to translate Internet hostnames such as www.ripe.net to IP addresses such as 193.0.0.214 . It is a distributed database in which domain names are maintained in a hierarchical tree structure. The DNS root nameservers maintain the authoritative list of servers for top-level domains such as .com, .net and .org. Any DNS query, except for queries in a domain made to a DNS server that is authoritative for that domain, requires a response from a root server to be answered. The response may be cached, but if the root servers are not available, no names can be resolved once the caches expire.
As the root servers are such a critical part of the Internet infrastructure, anycasting [18] is increasingly being used in global root server deployments. At least six of the 13 root servers (C, F, I, J, K, and M) have adopted anycast in some form, and some of these have deployed tens of nodes all over the world (for current status, see [23]). However, while there is little doubt that anycast improves resilience, the effects of anycasting on other aspects of DNS service quality are not well understood. In this paper, we present methodologies to study the quality of service provided by an anycast DNS server and the results of their application to the K-root server. A brief list of the contributions of this paper is as follows:
-
We present methodologies for evaluating the quality of service provided by an anycasted DNS server. By combining analysis of packet traces and server logs with active measurements on both the server and the client side, we are able to evaluate both the efficiency of the deployment as a whole and the benefit to clients of each individual anycast node. We show how these methods may be used to evaluate the location of a prospective new anycast node.
-
We apply the methodologies to the K-root DNS server, combining the results with geographical and operational data to provide what we believe is the most comprehensive analysis of the performance, client placement, and server load of an anycasted server to date.
-
We examine routing issues related to anycast, providing examples of non-obvious issues that can cause perfor-mance and reachability problems.
The rest of the paper is organised as follows: Section 2 provides background information on anycast, its goals, and the topologies used, and on the particular topology adopted by K-root. We present our methods in Section 3 and describe their application to the K-root server in Section 4. Section 5 discusses routing issues, and Section 6 examines the effects of anycast on server load. We conclude and discuss future work in Section 7.
2 Background
In this section we provide background information on DNS anycast and its goals and provide an overview of the types of deployments used, citing the K-root server as an example.
2.1 DNS Anycast
We define DNS anycast as the practice of providing DNS service at the same IP address from multiple geographic or topological locations [9, 1]. A node is a set of one or more DNS server machines and associated network equipment in a particular location; all nodes, regardless of location, answer DNS queries sent to the same IP address, which we name the service IP address. We name the set of all nodes the anycast cloud.
Every DNS query sent to the service IP address is routed to exactly one node, the best node, which is the closest node as determined by the routing protocol in use. At a given moment, different clients will in general have different best nodes according to their routing policies and metrics. A client making a DNS request does not usually know which node it is communicating with; however, most anycast deployments provide this information via a special DNS query, which returns the name of the node that answers it [27].
The DNS server machines are typically also reachable using unicast IP addresses, which we name internal ad-dresses. Depending on the type of deployment, the the internal IP addresses may be routed in the same way as the service IP address; if so, then the path taken by DNS queries to the service IP address (except the portion of the path inside the node itself) will in general be the same as the path to the internal IP addresses of the best node.
2.2 Goals of anycast
Anycast is deployed on root servers for various reasons, including increasing resilience, increasing performance, and providing a more stable service. Before describing the methodologies we propose to evaluate the quality of service of an anycast deployment, we briefly discuss these goals here.
One of the two goals of anycast stated in [1] is to improve the resilience of the DNS infrastructure to denial-of-service attacks. This problem cannot be solved simply by increasing server performance, because in most current deployments the servers can already withstand higher attack loads than the networks that surround them, and during an attack it is network congestion rather than query load that renders the servers unresponsive. Denial-of-service attacks are mitigated both by local nodes, which act as local sinks for DOS attacks in their catchment area, and by global nodes, which spread the attack load over multiple servers and networks. We may assume that that anycast improves resilience: the more nodes deployed and the more widespread the deployment, the less likely that a node failure or an attack can cause widespread disruption of service. However, we did not attempt to measure the effect on anycast on resilience.
Another goal of anycasting is to improve performance. Deploying nodes topologically close to clients will decrease query times; however, network topology only loosely correlates with geography [10] and therefore deploying nodes geographically close to clients is not necessarily an effective strategy for minimising query times. Furthermore, as we show in Section 5, the presence of local nodes may complicate the situation and actually decrease performance.
Finally, anycast should increase the reliability of DNS service. Deploying nodes close to clients should increase reliability by decreasing the number of network elements that queries must traverse. However, although the vast majority of DNS queries are simple request-response transactions involving one UDP packet in each direction, some queries involve multiple packets (e.g. queries using TCP, or queries in which the UDP query packet is fragmented). If a client's best node changes while the query is in progress, not all the packets will reach the same node and the query will fail. Therefore, as the number of deployed nodes increases, the number of routes competing in the routing table increases, and with it both routing churn and the probability of query failure in these cases.
The impact of this problem is not clear: for example, in a study of J-root [5] the authors state that this is a serious problem and recommend that stateful services not be run on anycast at all. Other work has since concluded that the
| Node | Code | Type | Date deployed |
| London, UK | linx | Global | 1997-05-19 |
| Amsterdam, Netherlands | ams-ix | Global | 2003-07-31 |
| Frankfurt, Germany | denic | Local | 2004-01-27 |
| Athens, Greece | grnet | Local | 2004-04-27 |
| Doha, Qatar | qtel | Local | 2004-06-22 |
| Milan, Italy | mix | Local | 2004-08-10 |
| Reykjavik, Iceland | isnic | Local | 2004-10-18 |
| Helsinki, Finland | ficix | Local | 2004-10-28 |
| Geneva, Switzerland | cern | Local | 2004-10-28 |
| Poznan, Poland | poznan | Local | 2004-11-24 |
| Budapest, Hungary | bix | Local | 2004-11-24 |
| Tokyo, Japan | tokyo | Global | 2005-04-19 |
| Abu Dhabi, UAE | emix | Local | 2005-04-26 |
| Brisbane, Australia | apnic | Local | 2005-06-29 |
| Miami, USA | nap | Global | 2005-07-29 |
| Delhi, India | delhi | Global | 2005-08-26 |
| Novosibirsk, Russia | nskix | Local | 2005-12-21 |
impact of node switches is not significant enough to be a concern [6, 12]. Our own results for K-root are presented in Section 4.3.
2.3 Anycast topologies
In the following we shall consider BGP-based anycast mechanisms as described in [1]. Each node announces to the routing system reachability information for the same network prefix (the service prefix), which contains the service IP address. The announcements from different nodes compete in the interdomain routing system, where they are propagated according to the usual BGP route selection process. Two types of anycast nodes are defined: global nodes and local nodes. Global nodes are intended to provide service to the entire Internet, and must have sufficient bandwidth and processing power to handle a global load of client requests. Local nodes are intended to provide service only to a limited area known as the node's catchment area. The distinction between node types is accomplished by using BGP policy mechanisms: firstly, the paths announced by global nodes are artificially lengthened using AS-path prepending; since one of the most important metrics used by the BGP route selection algorithm is the length of the AS-path, this causes the paths announced by local nodes to be preferred. Secondly, the announced made by local nodes are tagged with the “no-export” community value [8], which requests that their routing announcements not be propagated to other ASes.
Different root server operators use different deployment strategies. In the following, we term an anycast topology flat if it contains only global nodes, hierarchical if it contains a small number of global nodes close to each other and a large number of local nodes, and hybrid if it contains both a number of widely-distributed global nodes and a number of local nodes. Examples of flat, hierarchical, and hybrid topologies are J-root [5], F-root [1], and K-root respectively. A hierarchical deployment has both advantages and disadvantages with respect to a flat deployment. Since local nodes do not need to handle a global load of client requests, they may be deployed in areas with limited Internet connectivity and bandwidth; also, problems with a local node can at worst disrupt service in its catchment area. On the other hand, clients not in the catchment area of a local node will send queries to global nodes, and since the global nodes are concentrated in a small geographical area, this will result in high query latencies for distant clients. Finally, if an announcement from a local node is mistakenly propagated into the global routing table, the node and the surrounding network infrastructure may be overwhelmed by the resulting increase of requests.
2.4 K-root deployment structure
The K-root nameserver uses a hybrid topology which currently consists of 5 global nodes and 12 local nodes, as shown in Table 1. A node typically consists of two servers running the NSD nameserver software [17], a monitoring server, routers and switches. Queries are distributed between the servers using OSPF load balancing [2]. We name the network interface a server receives queries on its service interface; the service interface is reachable both through the service IP address, 193.0.14.129 , and an internal IP address, which is different for each server. Normally, the internal IP addresses are firewalled and queries sent to these addresses from the Internet are dropped. The prefix containing the node's internal IP addresses, which we name the node's internal prefix, is announced in the same way as the service prefix.
3 Measurement methodologies
In this section, we present our methodologies to evaluate the benefit of deploying anycast on a DNS server. We first discuss methods to evaluate the efficiency of the deployment as seen by a given client by using client-side and server-side measurements, and then present methods to evaluate the benefit of a given node in the cloud.
Our main performance metric will be query latency. Since our measurements on K-root hardware showed that response times are dominated by network latency, and that the capacity of a single node substantially exceeds both the typical network connectivity of a node and the total query load of the K-root server, in the following we shall neglect the effect of server load and focus only on network latency.
3.1 Measuring anycast efficiency
Ideally, every DNS query sent to the service IP address should be routed to the node with the lowest latency. Therefore, for every client we may see whether anycast is choosing the node with the best performance by comparing the response time of the node chosen by the routing system with the response times of the other nodes in the cloud. The former may be measured simply by sending a query to the service IP address; the latter may be estimated by measuring the response time of the internal IP addresses of all the nodes in the cloud. Note that this assumes that each node announces its internal prefix in the same way as the service prefix. This assumption is not true in all anycast deployments, but it may be verified, for example, by examining the BGP or router-level paths to the two addresses. It also requires that the internal addresses of all the nodes respond to probe packets, which may not be the case (for our K-root measurements, the firewall was opened to allow queries to the internal addresses).
More formally, given a population of clients P and the set of server nodes N , for every client ci we measure the latency RTT i to the service IP address and compare it to the latencies RTT in of the other nodes in N . If the deployment contains local nodes, a given client might not be able to reach all the servers in N , but it is obviously only interesting to measure the latencies to the set Nc of nodes that the client can actually reach. However, if we assume that routing is configured in such a way that local nodes are favoured (e.g. if the announcements of global nodes are prepended and the local nodes are announced with no-export), then Nc = NG ∩ A , where A is the client's best node1 . We define the anycast efficiency factor of the client, αi , as the RTT to the service IP address divided by the RTT of the closest global node:
| RTTi | ||
| αi | = | |
|
minn RTTin
|
If αi =1 , then the client's best node is the node with the best performance. If αi > 1 , then the routing system is choosing a sub-optimal node. If αi< 1 , then the client's best node is a local node.
3.1.1 Client-side measurements
The anycast efficiency factor for a given client client expresses how well the routing system does in selecting the best node for a particular client. Therefore, by measuring α for a suitable client population, such as that provided by the TTM network [22], Skitter probes [11] or PlanetLab [19] and aggregating the results, it is possible to obtain a general picture of how effective of an anycast deployment is in reaching its clients. Thus, client-side measurement allows us to obtain a fairly accurate picture of the efficiency of an anycast deployment in relatively little time.
3.1.2 Server-side measurements
Due to the fact that measurements are made by a limited number of probes, the results results suffer from various limitations. Firstly, they do not provide a complete evaluation. Secondly, they are biased by probe location. Finally, the probes are not necessarily representative of the client population of the anycast cloud.
Another possible approach is that of measuring latency from the server nodes to the client population. This has the advantage that the data set is much larger (for K-root, the client population seen in one day is of the order of one million, which is three or four orders of magnitude greater than any network of measurement probes that we are aware of), and that the data set is representative of the actual client population. Furthermore, if data on the number of client queries is available in addition to the client population, it is possible to weigh the anycast efficiency factor of every client by the number of queries it makes in order to evaluate the performance seen by those clients that are most important. Measuring the RTT to a client from a server can be done by sending an ICMP echo request (ping) packet and measuring the time it takes for the client to reply. Note that many clients may not respond to pings because they
1 For simplicity, we are ignoring the case in which the AS of the client could reach more than one local node. In this case, we assume that the interior routing of the AS has picked the correct node.
are behind firewalls or for other reasons, which biases the results; data on the incidence of this problem in the K-root client population is presented in Section 4.2.
Note that if the RTTs obtained by server-side measurement are to be representative of the actual RTT of a DNS query, then the path followed by probe packets and responses must be representative of the path taken by DNS traffic. This implies that (a) probe packets must be sent out using the same route that DNS replies use to reach the client, and
(b) probe replies must reach the server by the same route as DNS requests from the client.
Requirement (a) can be satisfied simply by sending probe packets from the DNS server itself or from another host that uses the same next-hop router. However, requirement (b) is harder to satisfy. Probe packets cannot be sent by a node using the anycasted service IP address, because if they were, the replies would reach the client's best node instead of reaching the node that sent the probes. Therefore, the source address must be a unicast address that is guaranteed to be routed to the node that sent the probe packet. Whether such an address is available depends on how routing announcements are made and on the internal structure of the node. As we have seen in Section 2.4, in the K-root deployment each node announces its internal prefix in the same way as the service prefix, so any IP address in the internal prefix may be used for this purpose.
3.2 Evaluating the benefit of individual nodes in the cloud
Measuring the latencies from the server nodes to the client population allows us to evaluate the benefit provided by each node in the anycast cloud. We may define the benefit provided by a given node to a given client as the increase of performance, if any, that the client experiences thanks to the existence of the node, or, equivalently, as the loss of performance that a client would see if the node did not exist. We may express this as the latency RTTi≠n that the
client would see if the node n did not exist divided by the RTT seen from the client i to the service IP address RTTi . Because we cannot predict the effect of routing changes, the value ofRTTi≠n is not known. However, if we assume
that routing is optimal, i.e. that every client selects the node with the lowest latency, then RTTi =minn RTTin and RTTi≠n =minj ≠n RTTij . Thus, for any client i and node n , we define the loss factor βin as follows:
| minj ≠n RTTij | ||
| βin | = | |
|
RTTi
|
Since we assume optimal routing, βin ≥ 1 . If βin =1 , then the node provides no benefit to the client; if βin =2 , then the presence of the node doubles the client's performance, and so on. It may also be useful to evaluate the effect on performance of a set S of nodes at the same time. For example, evaluating the combined benefit of all the nodes in a particular geographic region gives an idea of how much redundancy the nodes introduce, and evaluating the combined benefit of all the nodes except the first node deployed gives an idea of how effective the anycast deployment as a whole is. This can be done trivially by calculating the sum in (2) over all nodes except all the nodes in S .
Of course, the assumption of optimal routing does not hold for all clients. For example, as can be seen in Fig-ure 5(a), αi ≈ 1 only for about 50% of the clients that responded to our ping probes. However, we believe it is a useful metric in order to evaluate how well the server nodes are placed in relation to the client population.
Once the benefit of a node to each client has been determined, we may calculate the total benefit of a node Bn simply by taking the weighted average of the benefit seen by every client, where the weights are proportional to the number of queries that the client sends to the server:
| ∑i βinQi | ||
| Bn | = | |
|
∑i Qi
|
where Q i are the queries sent by the client i to the server in a given time interval. The higher the value of Bn , the more useful the node is; a node with βn =1 provides no benefit to clients.
4 Application of our methods to K-root
In this section we describe the application of our methods to the K-root DNS server. First, we performed client-side measurements from the TTM network to obtain a picture of the efficiency factor, and examined the stability of the average efficiency factor over time. We then used server-side measurements to obtain a more representative view of the global client population. Finally, we used the results of the server-side measurements to determine the benefit of each individual node in the cloud, the two global nodes in Europe, and the total benefit of the anycast deployment.
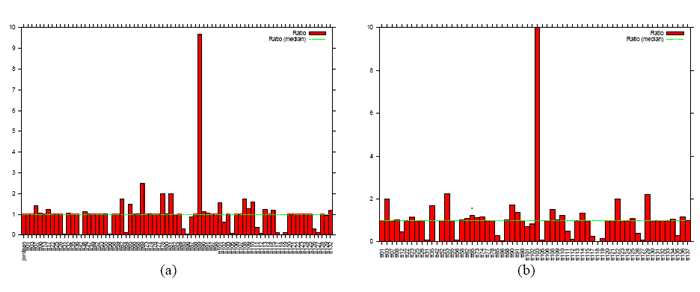
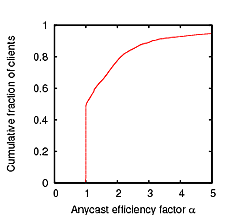
Figure 1: Efficiency factor α seen by TTM. (a) Two global nodes, April 2004; (b) Five global nodes, April 2005.
Click the images for a larger version
Measurements were taken using the dig command to query for the hostname.bind record. Every test-box i performed a set of 5 queries to the service IP address, then a set of 5 queries to each of the two internal IP addresses of every global node. (Since the internal IP addresses are firewalled and do not respond to queries, to perform these measurements we had to temporarily open the firewall.) From each set we then calculated αi as described in (1). As described in Section 3.1.1, if αi =1 then the routing system is choosing the optimal node; if αi > 1 , then the routing system is choosing a sub-optimal node; and if αi< 1 , then test-box i is using a local node2 .
As already discussed, our client-side measurement methodology assumes that the path to an internal IP address is the same as the path that would be taken to the node if that node were the node chosen by the routing system. In the case of K-root the internal IP addresses are announced in exactly the same way as the service IP address. However, the paths are still not guaranteed to be identical, since the service IP address and the internal IP addresses are in different prefixes, and BGP routing policies could in principle distinguish between announcements for the service prefix and for the internal prefixes, even though they come from the same source. However, we believe that current operational practices make this a rare occurrence; furthermore, querying the RIS [21] showed that the the AS-path to the service IP address was the same as the AS-path to one of the internal IP addresses in almost every case.
Two example results are in Figures 1(a) and 2(a), which plot values of αi measured on 2005-04-08 at 15:00 UTC and on 2006-04-12 at 00:00 UTC. As can be seen from the graph, most values of αi are close to 1, indicating that the routing system is selecting the appropriate nodes in most cases. This is even more visible in Figures 1(b) and 2(b), which only shows data for test-boxes whose best node at the time of measurement was a global node.
Note that in each of the two graphs in Figure 1 there is a notable outlier. These are due to particular performance problems caused by K-root's hybrid deployment and are analysed and explained in Sections 5.3 and 5.2.
4.1.3 Effect of number of nodes on efficiency
The graphs in Figures 1 and 2 show that the anycast efficiency seen by TTM did not significantly change between April 2005 and April 2006, even though the two data sets were collected about a year apart, and had substantially different deployments (in April 2005 K-root had two global nodes and nine local nodes, in April 2006 it had five global nodes and twelve local nodes). This suggests that K-root has not reached the point where there are too many
2 A result of αi< 1 could also be due to the path to the service IP address being different from, and slower than, the paths to every internal IP address. However, examining the query responses showed that in every case where αi< 1 , the node that replied was a local node.
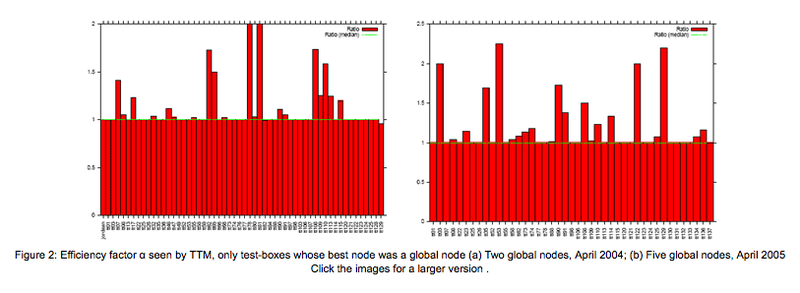
Click the images for a larger version .
routing announcements competing in the global routing system for BGP to draw substantially wrong conclusions and that there is still room for more global nodes.
4.1.4 Consistency of anycast efficiency over time
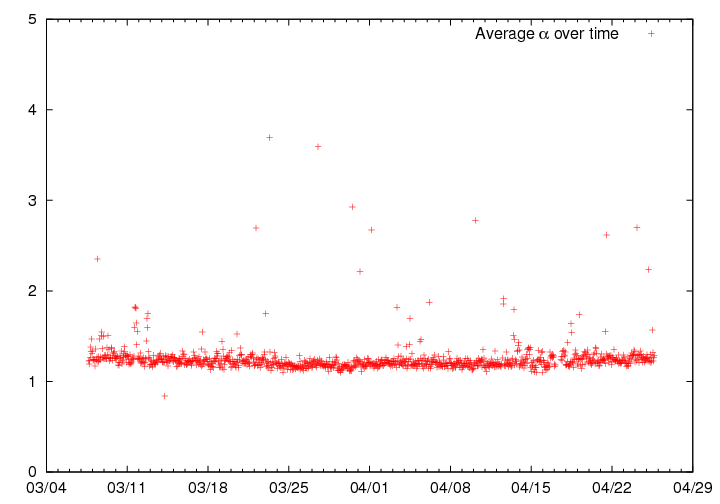
Click the image for a larger version
To determine whether the anycast efficiency factor is consistent over time, we repeated the measurements once every hour for the 7-week period between 8 March and 26 April 2006. For every hour, we averaged αi over all the test-boxes except tt103 and plotted the results. The results are in Figure 3. As can be seen, the average value of α is fairly constant over time.
4.1.5 Comparison with similar work
Our results show that the efficiency seen by TTM is quite good. This contrasts with existing work using similar methodologies which finds that BGP anycast has poor properties of locality [24, 4]. In particular, [4] examines the performance of the the J-root server, finding that that 40% of the clients used experienced values of α greater than 4. The authors suggest that the problem is due to to the fact that each J-root node is deployed in a POP of a different ISP and therefore the customers of each of those ISPs see as shortest path the node deployed in the POP of their ISP, regardless of their location. The same authors, in [3], study the anycast deployments of F-root and of the AS 112 project [25] with similar negative results. This suggest that the effects of anycast on latency are strongly dependent both on the type of anycast deployment used and on network topology and that further research is needed to model them.
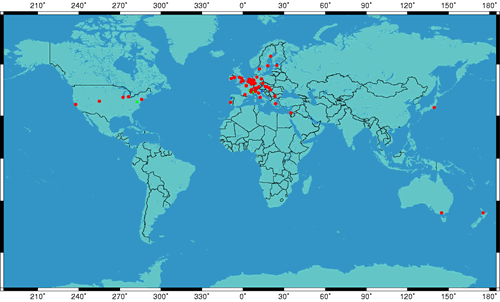
4.2 Server-side performance
The client-side results we have just described show that the K-root deployment is very effecient. However, the mea-surements taken by TTM are biased: firstly, the client population is limited to a few tens of nodes, and secondly, as can be seen in Figure 4, the positions of the test-traffic boxes are biased towards Europe. Therefore, we applied the methodologies described in Section 3.1.2 in order to obtain a more complete picture of the quality of service provided to the client population as a whole.
The global client population of K-root was obtained by analysing the packet traces of the global nodes. We examined 6 hours of data, for a total of 246,769,005 queries from 845,328 client IP addresses. From every node we then sent ping packets to these IP addresses using the custom pinger software developed by the authors3 .
In order to avoid loading the DNS servers themselves, the pings were run from the monitoring server in each node; to ensure the paths taken by the packets to and from the client were as similar as possible to the paths to the DNS servers, pinger was configured to use the same gateway towards the Internet as the DNS servers and to send the ping packets from using a source IP address on the same subnet as the servers' internal addresses.
In order to minimise the likelihood of routing changes affecting the RTTs to the clients, our goal was to to ping the whole client population in as little time as possible while limiting server load. Therefore, pinger was written to parallelise pings using a configurable number of threads; for our experiments we used 500 threads sending out one packet per second each. The measurement was performed on 18 April 2006 and lasted approximately two and a half hours, during which each client was pinged five times in consecutive seconds. As can be seen in Table 2, almost half of the IP addresses queried did not respond to our pings, possibly because they were behind firewalls.
|
Node
|
Total
|
Responded
|
%
|
|
linx
|
845328
|
456631
|
54.0
|
|
ams-ix
|
845328
|
479018
|
56.7
|
|
tokyo
|
845328
|
457115
|
54.1
|
|
nap
|
845328
|
463380
|
54.8
|
|
delhi
|
845328
|
463751
|
54.9
|
The values of the anycast efficiency factor α are shown in Figure 5(a). As can be seen, only approximately 50% of clients choose the node with the lowest latency. These results are substantially worse than those observed by client-side measurements using the TTM network presented in Figures 1 and 2; this may be due to the fact that the TTM test-boxes are predominantly based in Europe, which is very well provisioned with two K-root global nodes.
The rightmost column of Figure 9 contains CDF plots of the loss factor βin. The first two plots show that neither the LINX or AMS-IX nodes provide much benefit on their own. This result is surprising, because these are the busiest K-root nodes and the ones with the richest set of peering connections. The explanation for this is in Figure 5(b), which
3 The source code to pinger will be available on-line by the camera-ready deadline.
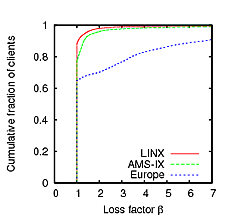
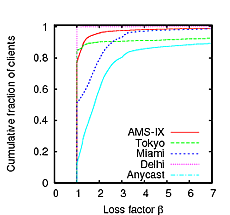
plots the loss factor of both nodes taken together. The graph clearly shows that although neither node provides much benefit on its own, taken together they are important; the low benefit each node has reflects the fact that the nodes are very similar from the point of view of clients and thus are redundant. The remaining three plots show that the Miami node provides moderate benefit for some clients, that the Tokyo node is the best node for a small population of clients, but those clients are very poorly served by the other global nodes, and that the Delhi node only provides marginal benefit.
These results are consistent with the calculated benefit values Bn of each node, shown in Table 3. As can be seen, there is a wide variation: the node providing the most benefit, Tokyo, has B =14 . 1 , while the node providing the least benefit, Delhi, has B =1 . 01 and thus its presence is only marginally useful. Taken together, LINX and AMS-IX have a high benefit value of 23.1 .
| Node | Benefit |
| linx | 1.5 |
| ams-ix | 1.9 |
| tokyo | 14.1 |
| nap | 2.5 |
| delhi | 1.01 |
| Europe | 23.1 |
| Anycast | 18.8 |
Table 3: Percentage of clients replying to ping requests
The server-side measurements also allow us to evaluate the benefit of deploying anycast as opposed to keeping K-root in only one location (before anycast was deployed, K-root only had one node at LINX; see Table 1). Figure 5(c) shows the combined loss factor of all the global nodes except LINX. As can be seen, more than 80% of clients have a loss factor greater than 1. This is also reflected by the combined benefit value of all the other nodes, BA =18 . 8 .
4.3 Impact of node switches
To evaluate the effect of routing switches on queries, we analysed all the UDP queries seen by the global nodes of K-root in a given time period. We processed queries in chronological order, and for every query, we logged the client IP and which node it was sent to. If a given client IP was observed to query a different node from the one it had last queried, we logged a node switch.
We repeated the experiment twice, once in April 2005 and once in April 2006. The results are in Table 4. As can be seen, in these two samples node switches are fairly rare: the April 2006 results show only 150 , 938(0 . 06%) node switches; that is, 99 . 94% of all queries made were made to the same node as the querier had used for the previous query. Furthermore, of 845 , 328 client IP addresses seen, only 2 , 830(1 . 1%) switched node one or more times during the 24-hour period. These results are comparable with those in [12], which studied all the anycasted root servers using DNSMON [20] client-side probes and observed node switches in approximately 0 . 017% of queries. If we compare
| April 2005 (2 Nodes) |
April 2006 (5 nodes) |
|
| Interval | 24 hours | 5 hours |
| Queries | 527,376,619 | 246,769,005 |
| Switches | 30,993 (0.006%) | 150,938 (0.06%) |
| IPs seen | 884,010 | 845,328 |
| IPs switching | 10,557 (1.1%) | 2,830 (0.33%) |
Table 4: Impact of node switches
the April 2005 data to the April 2006 data, we note a large increase in the percentage of node switches. This may be due to the larger number of routes competing in the global routing table leading to increased routing churn and more routing switches.
5 Routing issues
In this section, we examine various non-obvious routing issues that we observed during our analysis and that cause performance and reachability problems.
5.1 Performance degradation due to local nodes
Figure 2(a) shows that while local nodes can increase performance, they can also have the opposite effect. Of the 20 test-boxes whose best node is a local node, 16 (80%) have αi < 1 and thus benefit from the presence of the local node, but 4 (20%) have αi> 1 and therefore obtain worse performance by querying the local node than they would by querying the closest global node. The most obvious example of this behaviour is test-box tt89, whose performance is worse almost by a factor of 10. Queries from tt89, which is located in the UK, were being routed to the denic local node in Frankfurt, which had a response time of 28 ms, instead of the linx node in London, which had a response time of 3 ms (see Figure 6). When we analysed the results, the problem had been resolved and it was not possible to determine the cause of the problem with certainty. However, we believe the explanation is as follows: the path to the service prefix was announced by the Frankfurt node to an AS A which ignored the no-export community and propagated it to tt89's AS B . AS B also received the announcement for the service prefix from the London node, but since this path was at least three ASes long due to prepending, it preferred the announcement it received from A and thus chose the Frankfurt node. Unfortunately, we note that in current operational practices it is not unusual for operators to propagate routes with the no-export attribute to their customers. We note that it is not the presence of the local node that is causing the problem here: rather, it is the use of prepending on the global nodes that is causing clients to query local nodes even when a global node is better connected. This is one of the disadvantages of the hybrid deployment adopted by K-root.
193.0.14.129 k2.denic 29 k2.denic 30 k2.denic 29 k2.denic 30 k2.denic 29
193.0.16.1 k1.linx 4 k1.linx 3 k1.linx 3 k1.linx 3 k1.linx 3
193.0.16.2 k2.linx 3 k2.linx 3 k2.linx 3 k2.linx 3 k2.linx 4
193.0.17.1 k1.ams-ix 12 k1.ams-ix 11 k1.ams-ix 12 k1.ams-ix 13 k1.ams-ix 13
193.0.17.2 k2.ams-ix 12 k2.ams-ix 13 k2.ams-ix 11 k2.ams-ix 12 k2.ams-ix 13
Figure 6: Raw latency results from tt89 on 2005-04-08 (times in ms)
5.2 Performance degradation due to different prepending lengths
Due to the fact that AS-path length is a relatively coarse metric, announcing different prepending lengths from different nodes can lead to performance problems. The outlier in Figure 1(b), tt103, has an efficiency factor of 208. tt103 is in Yokohama, Japan, and reaches the Tokyo node in 2 ms. However, as shown in Figure 7, it is using the Delhi node, reaching it in over 400 ms. Subsequent traceroutes later showed that the path to Delhi was also very inefficient, going through Tokyo, Los Angeles and Hong Kong in order to reach India. Inspection of the BGP tables of tt103's AS, AS2497, show that all the AS-paths to the Tokyo node seen by tt103's AS, AS2497, are four ASes long, while the AS-path to the Delhi node, 2200 9430 25152 25152, is three ASes long. This is due to the Tokyo node announcing a non-optimal prepending length of four.
193.0.14.129 k1.delhi 422 k1.delhi 416 k1.delhi 423 k1.delhi 428 k1.delhi 419
203.119.22.1 k1.tokyo 2 k1.tokyo 2 k1.tokyo 2 k1.tokyo 2 k1.tokyo 2
203.119.22.2 k2.tokyo 2 k2.tokyo 2 k2.tokyo 2 k2.tokyo 3 k2.tokyo 2
203.119.23.1 k1.delhi 422 k1.delhi 418 k1.delhi 421 k1.delhi 415 k1.delhi 426
203.119.23.2 k2.delhi 422 k2.delhi 428 k2.delhi 419 k2.delhi 417 k2.delhi 417
Figure 7: Raw latency results from tt103 on 2006-04-12 (times in ms)
5.3 Loss of connectivity due to no-export
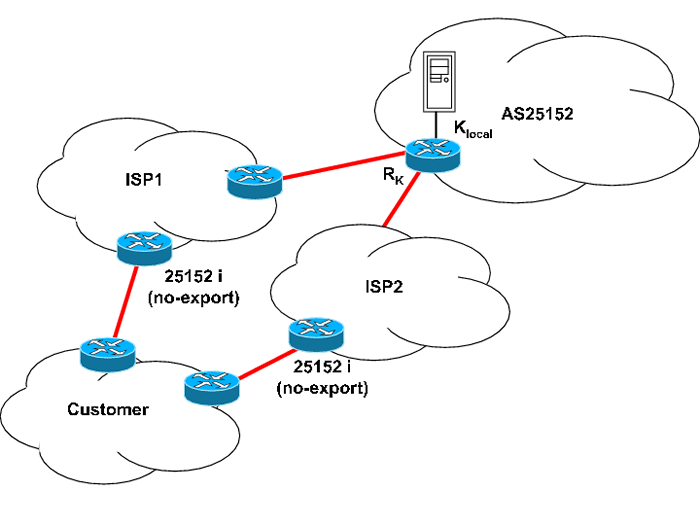
The use of the no-export community can lead to scenarios in which a client may not be able to reach K-root at all. This problem, first reported by Randy Bush on an operational mailing list [7], is due to the problematic interaction of no-export with anycast. Consider Figure 8: the customer AS receives transit from two upstream providers, ISP1 and ISP2. If the two providers both peer with a local node of K-root and honour the no-export community, then their routers will be forbidden to announce the route to the customer AS. In this case, the customer AS will have no route to K-root and will be unable to reach it at all.
This problem was addressed in the K-root anycast deployment by announcing a less-specific prefix of the service prefix, the covering prefix, without no-export. If a BGP router has a route to the service prefix, it will use it, but if it does not, it will use the less-specific route to the covering prefix. This ensures that the service IP is reachable.
Note that the covering prefix announcement does not affect routing: once packets addressed to the service IP reach one of the upstreams, they will follow the route to the service prefix and will thus reach the local node seen by that upstream. Therefore, the covering prefix is announced from one node only (currently, the AMS-IX node).
6 Effect of anycast on server load
In this section, we present operational data on the K-root deployment with a view to understanding the effects of anycast on server load. First, we analyse server logs order to study the effects of K-root's hybrid topology on load-balancing between nodes. We then examine the geographical distribution of the clients seen by each node.
6.1 Analysis of server logs
To determine the effects on server load of the deployment of new nodes, we analysed the server logs to obtain the daily average of the number of queries per second seen by each local node from January 2004 to April 2006. Our results are in Figure 10(a). As can be seen, deploying new local nodes does not decrease the number of queries processed, and thus the effectiveness, of existing local nodes. We would expect this to be the case: due to the small catchment areas of local nodes, the probability of a given network receiving announcements for more than one local node is very small. Note that we are assuming that the load offered to the K-root server is constant and independent of the nodes deployed, which is not strictly true due to the fact that many nameserver implementations select which server to query on the basis of past query latencies [26]. However, the addition of one local node to a root server system which already consists of tens of nodes is not likely to cause large shifts in traffic.
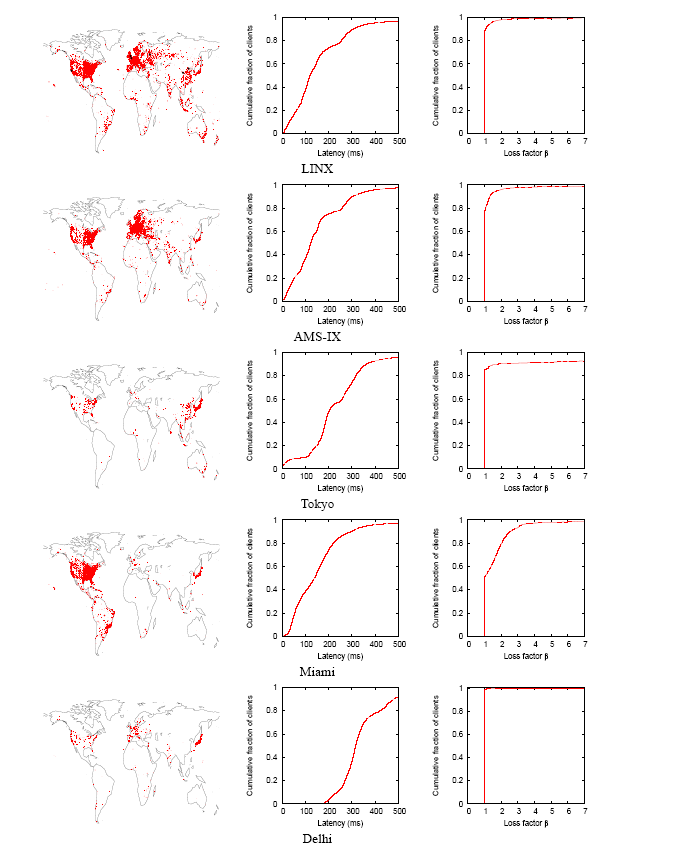
Figure 9: Client distribution of K-root global nodes. From left to right: query map; latency (ms); node benefit.
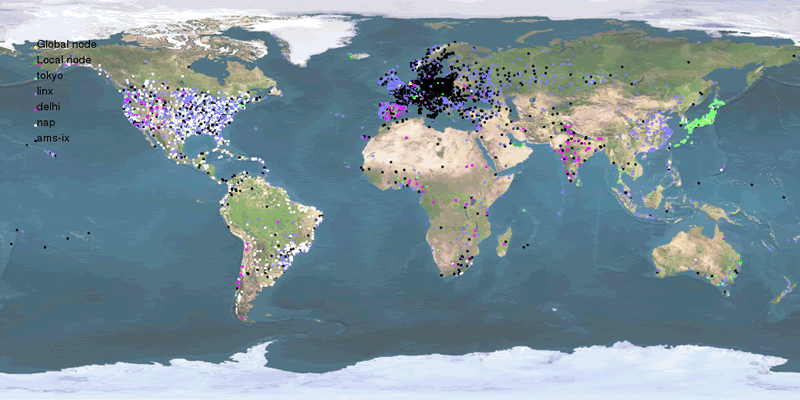
Figure 10: Geographical distribution of global node clients.
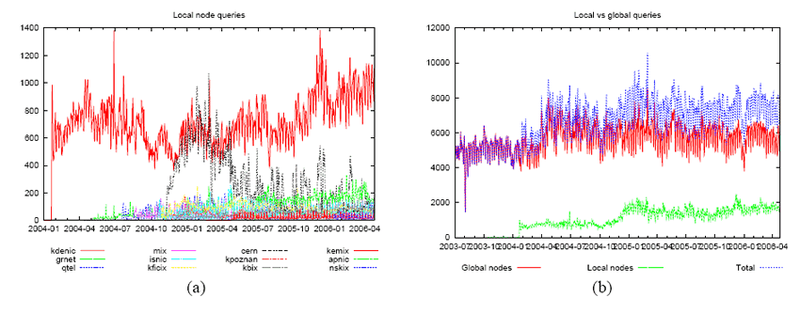
Figure 11(a) also shows that there is a very wide variation in the number of queries processed by global and local nodes. For example, the difference between the daily number of queries processed by the denic and mix nodes is about two orders of magnitude. This shows that the location of a node has a large impact on the effectiveness of the node itself and thus care must be taken in local node placement. However, we also note that if the intent is to increase performance, a local node can be beneficial even if it serves few queries if the location is so topologically isolated that performance of the other root servers is very low.
Figure 11(b) compares the aggregate traffic volumes of local nodes and global nodes. As can be seen, local nodes account for only about 20-25 percent of total traffic. This shows that deploying local nodes is not an effective strategy to decrease the query load on global nodes: even the two largest local nodes, denic and cern , do not process more than about 10% of the total query load. Figure 10(b) also shows that an increase in local node traffic does not seem to cause a corresponding decrease in global node traffic. This suggests that when a new local node is deployed, traffic is subtracted more from the other root servers than from the other K-root nodes.
6.2 Geographical distribution of queries by node
To discover the geographical distribution of K-root clients we extracted a list of IP addresses from approximately six hours of packet traces and used geolocation software to map them to geographical coordinates. The number of queries and clients seen by each node in this interval is in Table 5. The geolocation software used was the the free GeoLite [13], which is claimed to be approximately 97% accurate at the country level and 60% accurate at the city level.
| Node | Queries | Hosts |
| linx | 74300749 | 341337 |
| ams-ix | 38974255 | 221348 |
| tokyo | 24215868 | 93545 |
| nap | 34385634 | 167267 |
| delhi | 2761721 | 13131 |
Table 5: Queries used for geolocation
The results are in the left column of Figure 9 and aggregated in Figure 10. Every location containing one or more clients is mapped to a dot on the maps; the more IP addresses in a given area, the larger the dot. As can be seen from the maps, the LINX node is the one with the farthest reach: clients are spread all over the world as far as Australia, South America, South Africa, and the Far East. The AMS-IX has a slightly lower reach but is more concentrated in Europe. The clients of the Miami node are heavily concentrated in the Americas; this can also be seen in loss factor distribution, which shows a moderate number of clients gaining a moderate benefit, and in the latency distribution, which shows a m. The Tokyo node is very concentrated in Japan, probably due to the non-optimal prepending configuration already observed in Section 5.2. Finally, the Delhi node has very high latencies to most clients and is not substantially queried even in India.
7 Conclusions
In this paper we have presented methodologies for evaluating the performance of an anycasted DNS server that com-bine the analysis of packet traces and server logs with active measurements to evaluate both the benefit to clients of the anycast cloud as a whole and the benefit provided by individual nodes in the cloud. We have applied the methodologies to the K-root DNS server, combining the results with operational and geographical to obtain a comprehensive picture of the performance of K-root.
Our results show that anycast has good effects on latency, especially in Europe, which is very well provisioned with two K-root nodes, and that node switches, which have been identified in other work, are not currently a serious problem for K-root. Furthermore, the comparison of data gathered in 2005 on a deployment with two global nodes with data gathered in 2006 on a deployment with five global nodes shows that the K-root deployment has not yet hit the point of diminishing returns and that the deployment of future nodes could increase performance. Our results also show better performance than that observed in other work, suggesting that the types of anycast deployment and topologies used have a large impact on the effects of anycast and that further research is needed for a more general model.
In the future we would like to apply our methodologies to other root server clouds in order to determine the effects of different topologies on performance and to determine which topologies, if any, are optimal. Other problems we intend to work on are determining the effects of prepending schemes on anycast performance and developing a methodology for choosing the most effective location for a new node in the cloud.
Acknowledgements
The authors would like to thank Walter Willinger for his guidance and insightful comments and Daniel Karrenberg, Rene Wilhelm and Robert Kisteleki for useful discussion. Thanks go to Randy Bush for pointing out the loss of reacha-bility caused by no-export and Randy Bush and with Matsuzaki Yoshinobu for helping investigate tt103's performance problems.
References
[1] J. Abley. Hierarchical anycast for global service distribution. ISC technical note 2003-1, 2003.
[2] J. Abley.A software approach to distributing requests for DNS service using GNU Zebra, ISC BIND 9 and FreeBSD. ISC technical note 2004-1, Mar. 2004.
[3] H. Ballani and P. Francis. IP anycast measurement study. Unpublished manuscript.
[4] H. Ballani and P. Francis. Towards a global IP anycast service (pdf). In Proceedings of SIGCOMM '05, pages 301–312. ACM Press, Aug. 2005.
[5] P. Barber, M. Larson, M. Kosters, and P. Toscano.Life and times of J-ROOT. In Proceedings of NANOG 32, Oct. 2004.
[6] P. Boothe and R. Bush. DNS anycast stability: Some early results (pdf). In Proceedings of APNIC 19, Feb. 2005.
[7] R. Bush. Oh K can you see. NANOG mailing list archives, Oct. 2005.
[8] R. Chandra, P. Traina, and T. Li. BGP communities attribute. RFC 1997, Aug. 1996.
[9] T. Hardie. Distributing authoritative nameservers via shared unicast addresses. RFC 3258, Apr. 2002.
[10] B. Huffaker, M. Fomenkov, D. J. Plummer, D. Moore, and k claffy. Distance metrics in the internet. In IEEE International Telecommunications Symposium (ITS), Sept. 2002.
[11] B. Huffaker, D. Plummer, D. Moore, and k claffy. Topology discovery by active probing. In Symposium on Applications and the Internet (SAINT), Jan. 2002.
[12] D. Karrenberg. DNS anycast stability. In Proceedings of NANOG 34, May 2005.
[13] MaxMind LLC. GeoLite free country database. http://maxmind.com/ .
[14] P. Mockapetris. Domain names - concepts and facilities. RFC 1034, Nov. 1987.
[15] P. Mockapetris. Domain names -implementation and specification. RFC 1035, Nov. 1987.
[16] P. Mockapetris and K. J. Dunlap. Development of the domain name system. In SIGCOMM '88: Symposium proceedings on Communications architectures and protocols, pages 123–133. ACM Press, 1988.
[17] NLNet Labs. NSD nameserver. http://www.nlnetlabs.nl/nsd/ .
[18] C. Partridge, T. Mendez, and W. Milliken. Host anycasting service. RFC 1546, Nov. 1993.
[19] Planetlab. http://www.planet-lab.org/ .
[20] RIPE NCC. DNSMON project. http://dnsmon.ripe.net/ .
[21] RIPE NCC. Routing Information Service. http://www.ripe.net/ris/ .
[22] RIPE NCC. Test traffic measurements service.http://www.ripe.net/ttm/ .
[23] DNS root nameservers web site. http://www.root-servers.org/ .
[24] S. Sarat, S. Pappas, and A. Terzis. On the use of anycast in DNS (pdf). In ACM SIGMETRICS 2005, June 2005.
[25] P. Vixie. AS112 project. http://www.as112.net/ .
[26] D. Wessels. Update on anomalous DNS behavior. In Proceedings of NANOG 29, Oct. 2003.
[27] S. Woolf and D. Conrad. Identifying an authoritative nameserver. Work in progress.